Are We Headed For A Recession?
- Patrick Ling

- Apr 10, 2023
- 2 min read
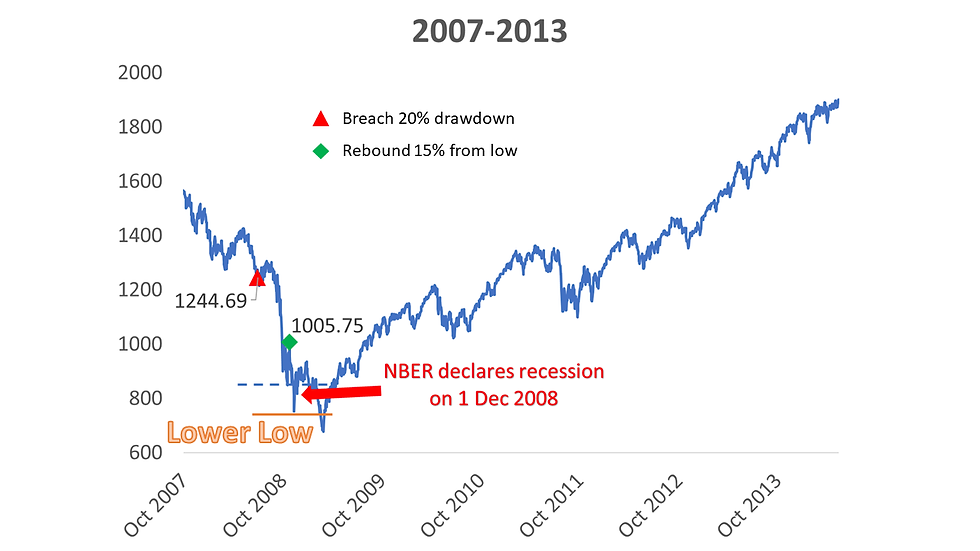
The biggest question on everyone's mind now is whether we are headed for a recession. There is no shortage of opinions from influential voices, so I will not offer any opinion. What I will do is look at the recent price action of the S&P 500, and look back at previous periods with similar price action and what happened subsequently. The price action I'm referring to is a greater than 20% drop from the peak, followed by a rebound greater than 15% from the low, which then led to a subsequent lower low. This is illustrated in the price chart below.

I looked back as far as the beginning of the S&P 500 in 1928. Outside of the Great Depression, there were 12 episodes of the S&P 500 dropping more than 20% followed by a rebound greater than 15% from the low. Only 3 episodes led to a subsequent lower low. The rest resulted in the start of a new bull market. An example is shown below.

Let's now take a closer look at the two instances where the S&P 500 made a lower low since that is what happened recently. The two periods are the Tech Bubble in 2000 and the Great Financial Crisis in 2008. Their charts are shown below.


These two periods are the most similar to what we are experiencing today, but this is where the similarities end. In both instances, the National Bureau of Economic Research (NBER) declared a recession shortly after the lower low in the S&P 500. Today, it doesn't look like the NBER will call a recession anytime soon. To know why, let's look at the historical unemployment rate.

The NBER always declares a recession after the unemployment rate has been rising for a while. The latest unemployment rate shows that workers are still gainfully employed today. Perhaps the unemployment rate might increase soon, but for now, a recession is nowhere in sight. Once again, we find ourselves in uncharted territory.


Comments