
How Does Volatility Impact Future Outcomes?
- Patrick Ling

- Jul 20, 2023
- 3 min read
Volatility is the least understood topic among investors. It is not as intuitive as returns. It is not linear. It requires some knowledge of statistics. However, it has a big impact on future outcomes so it is just as important as returns, if not more important.
The easiest way to understand volatility is to equate it to the range of possible future outcomes. The larger the volatility, the greater the range of future price moves. Volatility is also called standard deviation. In statistics, we can expect 99.7% of price moves to fall within +/- 3 standard deviations of the mean. So if the daily average return is 1% and the daily standard deviation is 1%, we can expect 99.7% of daily moves to be between -2% and 4%. This assumes a normal distribution which is not a perfect model of the real world but it is a working assumption.
There is a tool in finance called Monte Carlo Simulation. It is just a fancy name for using computers to simulate many future price paths based on certain statistical characteristics of the underlying. If we have the mean return and volatility of the underlying security, we can perform many path-dependent simulations to predict the range of future price paths.
I have simulated 100 future price paths for both the S&P 500 and the multi-strategy portfolio that we teach, using their respective historical CAGR and volatility. The data for S&P 500 goes back to 1992 which is the earliest available data on Yahoo Finance. The data for the multi-strategy portfolio goes back to 2006.

S&P 500 Monte Carlo Simulation

You can see that the future price paths for the S&P 500 are rather dispersed and the end point can be very different. There is a 21% chance of the S&P 500 losing money after 10 years, with a small 1% chance of even losing more than 50%.
Multi-Strategy Monte Carlo Simulation
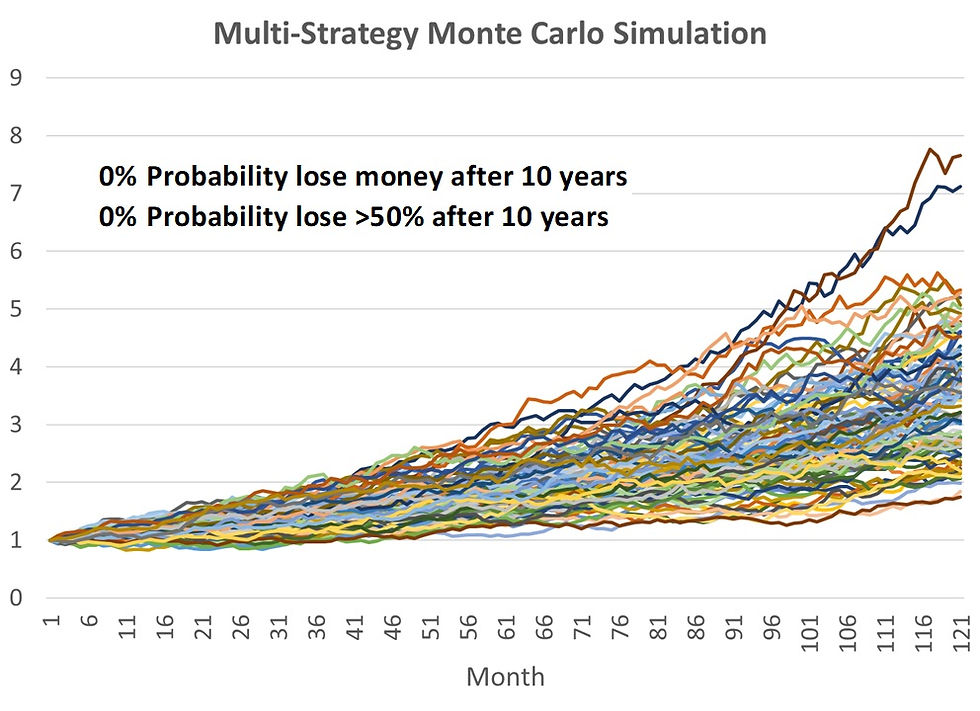
In the case of our multi-strategy portfolio, all future price paths led to gains after 10 years. The only difference is the magnitude. This is thanks to the low volatility of the multistrategy portfolio. Now you are more assured of achieving your financial goals.
Monte Carlo Applied To US Indices
We can also apply the same analysis to the three US indices, namely S&P 500, DJIA, and Nasdaq. However, because the three indices are highly correlated, we need a lot more Monte Carlo simulations to get a more stable probability of outcomes before we can compare. Therefore, I have performed 10,000 simulations for each index, and the results are summarized below.

The Nasdaq has the highest CAGR among the three but due to its high volatility, it has the highest chance of losing money after 10 years. Surprisingly, DJIA has a higher CAGR than S&P 500 and yet has the lowest probability of losing money after 10 years. This is another good reason to pick the Dow Jones Industrial Average as the universe for our trend-following strategy.
Make use of our July promotion to learn how to build a multi-strategy portfolio, or just talk about it over coffee.


Disclaimer & Disclosure
We are not financial advisers or fund managers. The information published on this Site is provided for informational purposes only. It is not intended to be, nor shall it be construed as, financial advice, an offer, or a solicitation of an offer, to buy or sell an interest in any investment product. Nothing on this site constitutes accounting, regulatory, tax, or other advice.
Any performance shown on this Site is model performance and is not necessarily indicative nor a guarantee of future performance. You should make your own assessment of the relevance, accuracy, and adequacy of the information contained on this Site and consult your independent advisers where necessary.
AllQuant is carrying out introducing activities for iFAST Global Markets (Singapore) as an independent entity and is NOT an agent, servant, employee, representative, or in partnership with iFAST Global Markets (Singapore). AllQuant will be receiving remuneration or introducing fees from iFAST Global Markets (Singapore).


Comments