
2021 in Review – AllQuant Multi-Strategy Model Portfolio (iFAST)
- AllQuant

- Jan 5, 2022
- 5 min read
Another year just went by and we are now into 2022. So before I start, a very Happy New Year and a great 2022 to all of you and your families. As always, time passes in a flash when we looked back and it is now time for us to review how our AllQuant Multi-Strategy Model Portfolio did in 2021. This portfolio can be implemented with the help of an iFAST Global Markets adviser.
An Overview of the Multi-Strategy Model Portfolio Performance
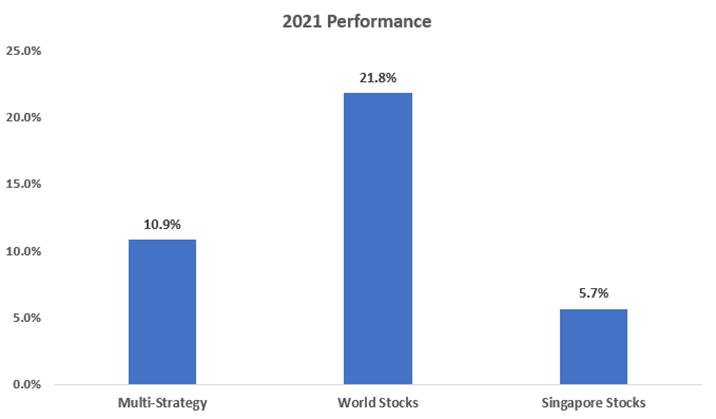
2021 is an eventful year that sees great dispersion in performance across the world and asset classes. The multi-strategy portfolio grew 10.9% after factoring in fees. This is well within its historical CAGR of around 11.2% between 2005-2020.

The model sees better performance for the first half of 2021 where it delivered about 8.1%. The second half of 2021 poses a more challenging period and the model is up only 2.8%. All in, there were 4 down months in the year with September being a particularly difficult month where most asset classes headed south. In September, the portfolio suffered a loss of 3.6% which is also well within the norm and far from its worst monthly loss of 8.6% back in 2009. This was amidst concerns from rising inflation pressures, central banks transitioning into a tightening mode, slowing global growth, etc. Such episodes where all asset classes go down together have flared every now and then. But all turn out to be relatively short-lived as was the case here as well.
In terms of yearly performance, the multi-strategy portfolio lagged the world stock market as represented by MSCI World Index where US stocks have a heavy allocation. This is in line with expectations as the multi-strategy portfolio comprises different asset classes which tends to drag or lag behind stocks during a particularly bullish period. But in terms of performance, the portfolio still fared better than the Singapore stock market as represented by MSCI Singapore Index. (Note: all performances are measured in USD terms)
If we look further back and take 2021 performance into consideration since Mar 2005, the model remained fairly stable with CAGR still hovering at 11.2%. It also still outperforms both the World and Singapore stocks over the long term on both an absolute and risk-adjusted basis.


US large-cap stocks delivered a strong performance against the rest
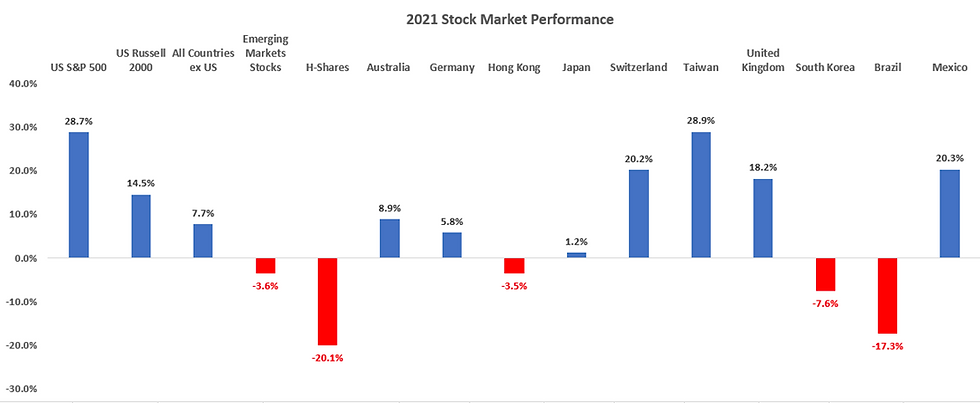
The US stock market has been on a roll ending the year on a record high in 2021. Large caps, in particular, delivered exceptional performance. The S&P 500 ETF is up 28.7% in 2021. This is almost twice what the Russell 2000 index, comprising mid to smaller cap US companies, achieved. Amidst this bullish euphoria in the US, the international stock market scene, however, is a lot more varied. Not all stock markets performed as well. The global stock market excluding the US delivered just 7.7% (iShares MSCI ACWI ex. US ETF, Ticker: ACWX) with emerging markets down 3.6% (iShares MSCI Emerging Markets ETC, Ticker: EEM).
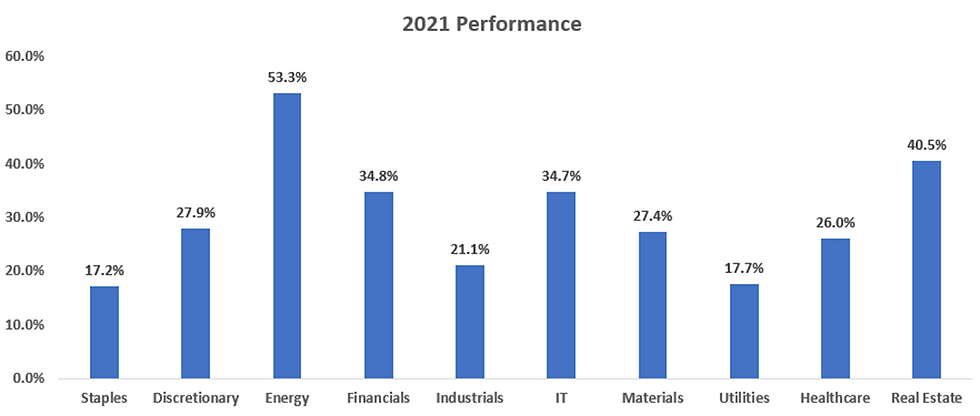
Cyclical sectors - Energy, Financials and Real Estate took the lead
All stock sectors made good money in 2021. The defensive sectors received a large boost in December bringing their performance closer to the rest. Meanwhile, the top-performing US sectors for the year is Energy, Financials, and Real Estate. All 3 are cyclical sectors that have positively benefitted from increased money flows and inflation expectations.
China markets suffered under the regulatory crackdown
China stock market, using MSCI China Index as a proxy, is down 21.72% in USD terms. This is in stark contrast to the US. It all began when China starts to actively push for its goal of common prosperity starting with Jack Ma, Alibaba’s founders, as one of the first high-profile casualties. Thereafter, the Chinese government extended its hands across different areas, moving in on giant internet tech, property, and education companies on grounds of security and anti-monopoly issues.
The long-term aim is for a good cause to maintain social stability and the betterment of all its citizens as opposed to what the US is experiencing today in terms of an ever-widening social divide. But while the cause is noble, this inevitably shakes investor confidence. It also remains to be seen how a balance can be struck between capitalism and “common prosperity” to foster the necessary environment to generate growth and innovation in this competitive world.
Safe Haven assets on retreat from higher rates and stronger inflation outlook
US Treasuries and Gold headed south moderately in 2021. The release of the pent-up demand from the pandemic while global operations have yet to be fully restored has led to supply and labor shortages. This caused a surge in prices and increased expectations of inflation. CPI grew 6.2% year on year in October and 4.9% year on year in November 2021. Besides faster QE tapering, the markets also expect an increasing pace of rate hikes going to 2022.
Our multi-strategy portfolio has regular exposures to these assets over the year with US Treasuries being one of the largest components in some of our strategies. These are the main drag to our portfolio in 2021.

That said, some levels of inflation are to be expected as part and parcel of a growing economy. And in terms of inflation levels now, we are still nowhere near hyperinflation (in excess of 50%) or the high levels experienced in the late 70s to early 80s (>10%) yet. Part of what we see today is accelerated by supply and labor disruptions triggered in the aftermath of the pandemic, while believed to be transitory, has lasted long enough to impact prices for daily consumers.
The more important question is whether this high inflation trend can sustain itself? We have no clear answers either. But there is a good chance the price pressure will be relieved once Covid-19 controls are relaxed and life and mobility normalized. And with US Fed moving into a more hawkish mode with faster tapering and planned hikes, these works against inflation.
And based on CPI data from 2005 till now, the multi-strategy portfolio does not seem to exhibit any correlation with inflation, at least at those rates.

That sums up our review of 2021. Let's get ready for a brand new 2022!
Note: All performances mentioned in this post are measured in USD. All fees are factored in. The multi-strategy portfolio performance is based on the model. Live performances may vary depending on executions, sizing precision, and variations to the strategy employed, etc. This portfolio uses the same underlying principles we teach in our courses, but employs more advanced techniques, and has a more diversified exposure to international equities and more asset classes.
For those who are interested in how you can build this multi-strategy portfolio with an iFAST Global Markets (Singapore) representative., click on the button below to visit our landing page and fill up a simple form. After that, an iFAST Global Markets representative will get in touch with you.


Comments