
10 Important Things You Should Know About The S&P 500
- Eng Guan

- May 23, 2023
- 7 min read
Updated: Jun 13, 2023
S&P 500 is the defacto stock index that comes to our minds when talking about the broad health of US stock markets. When we want to know how the US stock market is doing, we instinctively look at the S&P 500 as a proxy. This important index represents 500 of the largest US-based listed companies across different sectors. While it is not directly tradable, there are many exchange-traded products that seek to replicate its performance including ETFs, mutual funds, and futures. The history of the S&P 500 goes back a long way and there are many interesting statistical observations that can be made about this index. How much do you know?
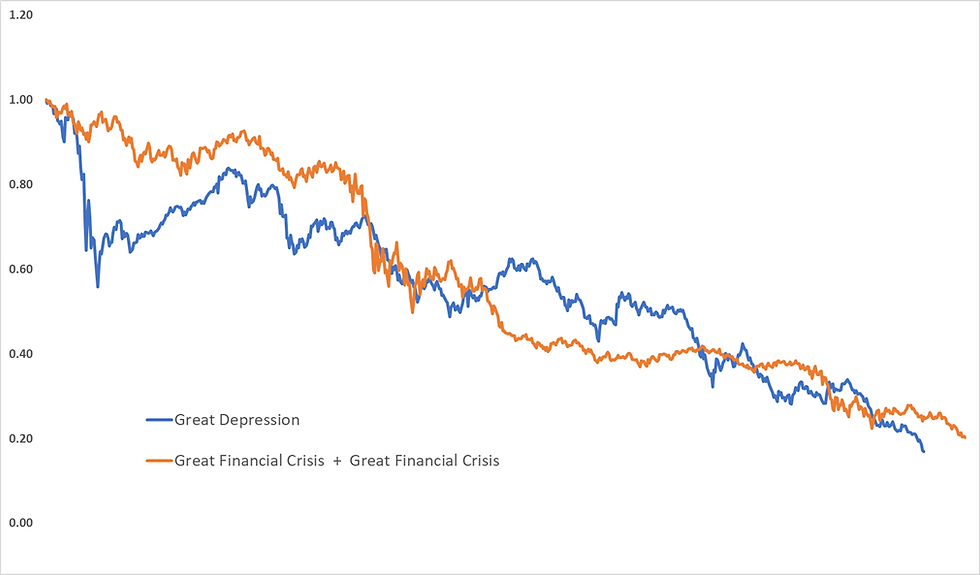
1. Which is the worst crisis S&P 500 experienced?
Unless you are a centenarian now, you probably would not live through the ultimate “dark ages” for the US stock market. For most, the worst we have seen is the Great Financial Crisis that happened during 2007-2009. But even that pales in comparison to the Great Depression in 1929 – 1932. In terms of how much the S&P 500 dropped from its high before these crises hit, the Great Depression period reigns supreme. S&P 500 virtually collapsed a jaw-dropping 83% from Sep 1929 to Jun 1932! Let me put this through in another way, you would need to stack 2 Great Financial Crisis one after another to achieve anywhere close to the damage delivered by the Great Depression.
2. How much did S&P 500 gain since 1928?
Despite all the crises, the strength of the US markets is remarkable, given time of course. If you had invested a dollar in 1928, never taken out a single cent, and reinvested all your dividends back in, that dollar is now worth $7,789 today. So, if what you invested is 1,000 bucks, you would be a multi-millionaire worth almost $8 million today. The caveat is you need to make sure you live a really long life.

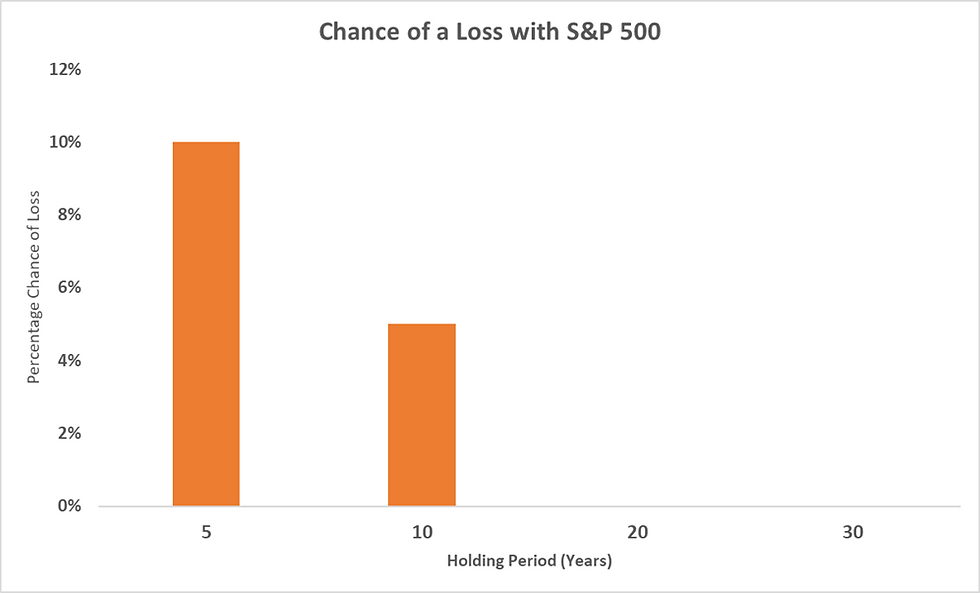
3. What are the chances of losing money with the S&P 500 over a 5, 10, 20, or 30-year period?
We know the S&P 500 grows over the long term. There is enough evidence and rationale supporting this. But what we are often shown is a 100-year chart where all the downturns get buried amidst the data. That, however, does not mean you can’t go underwater over shorter timeframes. It just means that the longer the horizon you have, the lower your chance of losing invested capital. In fact, if you hold an investment in S&P 500 over 20 years or more, based on historical data, your chance of suffering a loss (not taking into account inflation) is 0%. Of course, how much you make during this period and whether you meet the target you set is another story. Read more about this here.
4. What is the longest time S&P 500 took to recover after bottoming?
For those of us who have invested since the 80s, the longest recovery the S&P 500 took is about 4 years. That happens after the bottom of the dot com burst in 2002. This is the time it took S&P 500 to pull itself out from the bottom of the bear market and regain back its former high. If 4 years sounds long to you, then you might want to know that this is far from the record holder. The longest recovery on record dates back much further to the Great Depression. It took S&P 500 12.5 years to climb out from the pit created during the Great Depression. But even then, this is nothing compared to Japan, which took more than 30 years to recover.
5. What are the longest continuous losing and winning streak for S&P 500?
Have you ever watched your investments go down, down, down, and down continuously for like an eternity? Alright, of course, it’s not literally an eternity but it might feel like it when you are in one. It is a slow and painful watch that saps your morale and confidence every day. If you are in the market long enough, you will surely encounter such episodes. On a positive note, there only 10 episodes since 1928 where S&P 500 falls continuously over 10 or more trading days. The longest stretch is a fall over 12 consecutive trading sessions. That is seeing S&P 500 fall every single day over more than 2 weeks. It might sound kind of scary, but in terms of loss, it is just 6.4%. In fact, in almost all the 10 episodes across history, the cumulative loss for each of these streaks is less than 10%. The only exception is one which happened during the Great Depression period and that caused a 23% drop.
Now, good news on the flip side. There are a lot more consecutive winning streaks for S&P 500. In total, there are 34 episodes where S&P 500 rose continuously over 10 or more trading days. The longest continuous stretch is 14 trading days. That is almost 3 full weeks. But again, the gains over such episodes average just 5% with the highest being 9%.
6. What is the worst day and best day for S&P 500?
If the worst losing streak during Great Depression dealt you the damage of 23%, how about losing 21% in a single day? Yes, you hear that right, a single day. That is how much the S&P 500 lose on its worst day. It happened on 19 Oct 1987. S&P 500, which is already in the midst of a pullback, crashed violently on 19 October 1987 now also known as the Black Monday. Many theories abound regarding what triggered the plunge but program trading bore the brunt of the blame. This is in statistical terms a 29 standard deviation event, a really super black swan event. And what does that mean? It means such events should occur only once in 1.21E+182 years. That is enough time to go way back before even our universe is born but still, it happened. This catastrophic day is also why there are circuit breakers to halt trading on extreme down moves in today's market.
While the best day isn’t as “impressive” as the worst, it isn’t too shabby either. S&P 500 clocked a best one-day return of nearly 17% on 15 Mar 1933.
7. How many technical bear markets are there since 1928?
There is a total of 12 bear markets, technically at least. These are periods where S&P 500 fell more than 20% from its highs. So, on average, you can look forward to at least one technical bear market every 10 years. The typical time taken to hit the bottom is around a year. But the range is wide, it can be anytime from slightly over a month like what occurred during the Covid-19 flare-out in 2020, or over 2 and half years like the Great Depression.

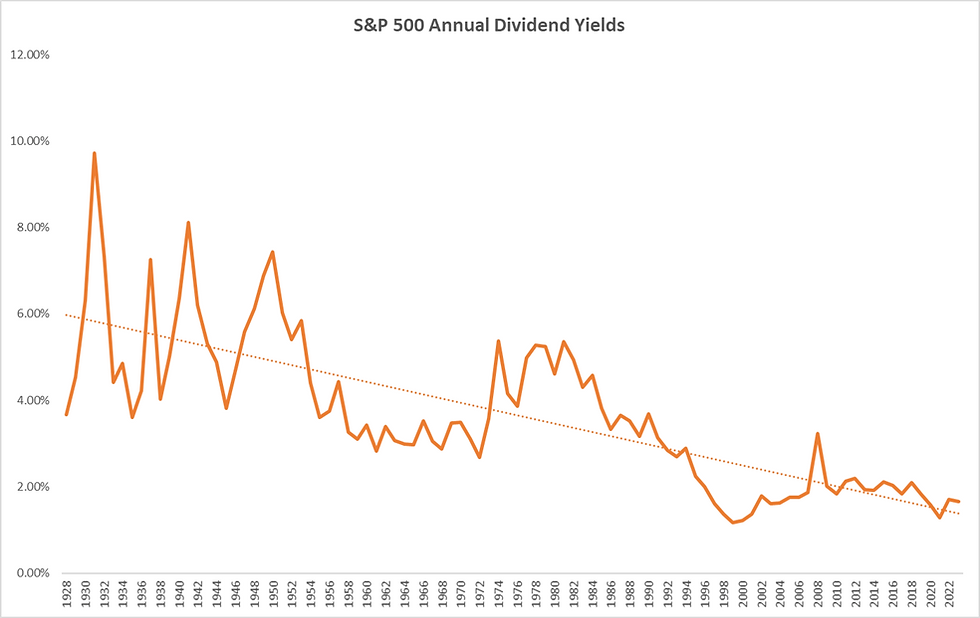
8. What is the highest annual dividend S&P 500 paid as a group?
The dividends paid by S&P 500 companies have been on the trend down. It has been under 2% annually since 2018. But do you know that it used to be much higher in the past? And the highest on record was 9.72% in 1931. This is not without rationale. If you look at the past, interest rates were also higher, therefore companies need to boost their dividends to maintain their appeal. And the S&P 500 today is also different from that of the past, with technology companies, now occupying the biggest pie in the index. Most of these companies pay little to no dividends.
9. How long does a company stay in the S&P 500?
The S&P 500 is not a static and unchanging basket of stocks. There are criteria companies have to satisfy to be included in the index. And over time, there are those who dropped out and new ones added. There are numerous reasons. Some companies merged, some split, some become defunct and are no longer around, some were delisted, some went private, some no longer meet the requirements to be included, etc. In fact, the S&P 500 wasn’t 500 when it was first incepted in 1923. Back then, there are only 233 companies. It was only in 1957 that the index expanded to cover 500 companies. In a study done by McKinsey, the average lifespan of a company on the S&P 500 was 16 years as of 2021. They also predicted that 75% of the companies would be out of the index by 2027.
10. S&P is more concentrated than you think.
The S&P 500 is a market-weighted index. That means the weight of each company in the index is determined by their market capitalization. Hence, the weights are not evenly distributed even though it represents 500 companies. The top 2% of the index alone, or about 10 companies, accounts for 28% of the value in this index. These top companies include well-known names such as Apple, Microsoft, Amazon, Nvidia, Alphabet, etc. So as you might also have guessed by now, the S&P 500 has a large exposure to tech companies. In terms of exposure, technology companies represent 29% of the index.
Let's have a chat over coffee!

We have been meeting up with students or clients who are implementing quantitative strategies with the help of a senior investment adviser from iFAST Global Markets, Ou Da Wei. During the sessions, we shared the latest updates on our multi-strategy portfolio and the newly minted capital-protected portfolio. We also talked about markets and general investing. Most importantly, we had a relaxing informal coffee chit-chat. We are extending the invitation to everyone.
Whether you are thinking of implementing advanced quantitative strategies, or simply looking to find out more about what you can do in today's market, we look forward to meeting you for a coffee chit-chat.
Just register your interest on our event page (click on the button below) and let us know if there are any specific topics of interest to you. We will try and arrange something. If you do not have anything in mind, don't worry, we will think of something :)
Disclaimer & Disclosure
We are not financial advisers or fund managers. The information published on this Site is provided for informational purposes only. It is not intended to be, nor shall it be construed as, financial advice, an offer, or a solicitation of an offer, to buy or sell an interest in any investment product. Nothing on this site constitutes accounting, regulatory, tax, or other advice.
Any performance shown on this Site is model performance and is not necessarily indicative nor a guarantee of future performance. You should make your own assessment of the relevance, accuracy, and adequacy of the information contained on this Site and consult your independent advisers where necessary.
AllQuant is carrying out introducing activities for iFAST Global Markets (Singapore) as an independent entity and is NOT an agent, servant, employee, representative, or in partnership with iFAST Global Markets (Singapore). AllQuant will be receiving remuneration or introducing fees from iFAST Global Markets (Singapore).


Comments