
What Is All This Yield Curve Talk About?
- AllQuant

- Mar 29, 2022
- 6 min read
Most of us started out investing in stocks. And it remains a key holding throughout our investment journey. For some, that may even be the only asset class they know aside from real estate properties. But that said, the entire financial markets are more interconnected than we think. And there is much information we can glean from other assets such as the US Treasuries. In particular, market participants had long used the Treasury yield curve as one of the guides on financial health. And if you follow market news recently, you will come across articles flashing warnings on the yield curve flattening and inverting.
What do all these mean? Let's look at it bit by bit.
What are US Treasuries?
US Treasuries are debts issued by the US government. In short, if you buy US Treasuries, you are lending the US government your money. They are the equivalent of our SGS bonds in Singapore and are considered a global safe-haven asset with virtually no risk of default. Because the US Government can always print more money to pay back what they owe. This is unlike bonds issued by corporate companies. If they run into cash flow issues, then your promised coupon payments and even the principal amount you invested can be at risk.
Now, debt is a key engine for growth. And if you are not aware, the most powerful nation in this world - the United States - is an empire built on debt and more debt. As of February 2022, US's national debt crossed over $30 trillion and outstanding US Treasuries account for $23 trillion (compare this with about USD 160 billion for SGS bonds). Of course, they are the only nation that can pull this off due to their special global status.
Bonds have different duration and yields
Similar to a home mortgage loan, Treasury securities come with different durations. There are short-term Treasuries called T-bills that mature in less than a year. Then we also have the intermediate-term 10-year Treasury Note as well as longer-term Bonds that mature in 20 years or more.
T-Bills are issued at a discount from par ($1000). For example, you may pay $990 for a $1000 T-bill that matures a year later. Between now and a year later, you don't get anything in between. But at the end of a year, you will receive $1,000 when the government redeems the bill. So effectively, that works out to a yield of 1.01% ($1000 / $990 - 1).
Nominal Treasury notes and bonds are issued at par and it pays you a fixed rate coupon based on the par value every 6 months. But for simplicity, let's assume they pay annually. So a $1,000 T-bond that matures in 20 years with a 3% coupon rate pays you $30 every year and returns back your $1,000 at the end of 20 years. The yield of this bond at the point of issuance is 3% and this is also known as the par yield.
So the yield of these bills, notes, or bonds is what you would make per year if you hold them to maturity. Of course, there is an assumption here that you will and can reinvest the coupons at the same yield during this period.
So Where Does the Yield Curve Fits In?
A Yield Curve is simply a plot that shows you the yields of bonds priced at par across various maturities. It gives you an instant snapshot of where the interest rates are today based on the duration you are interested in. Aside from that, people are also interested in the general shape of the yield curve.
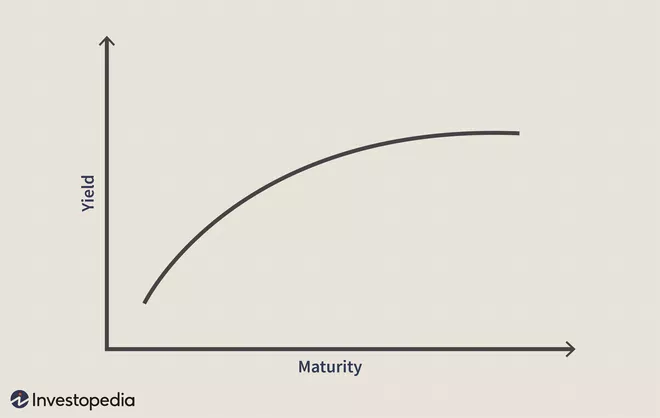
The Shape of The Yield Curve
.It would not be hard to imagine what a typical yield curve would look like. Under normal circumstances, we expect the yield curve to be upward sloping. Why? Because, if you are the lender, you would want a higher interest rate on a longer-term loan to compensate for greater uncertainties. If you put your money in a fixed deposit, I am sure you expect a higher rate for a 2-year deposit over a 6-month deposit.
But as always, there are exceptions. A yield curve can become inverted. That means the yields or interest rates of the longer-dated bonds are lower than the shorter-term ones. And why does that happen?

Now, different parts of the yield curve are subject to their own forces of demand and supply. The market may hold different expectations on where these rates should be. What the market expects to happen 10 or 20 years down the road can be very different from what they think is going to happen in the next 3 months or even the next 1 to 2 years.
For example, the shorter-term yields, in particular, are more directly impacted by the Federal Reserve through its policy actions. If the Federal Reserve hikes the Fed Funds Rates, you can expect the short end of the curve to move up accordingly. The long end of the curve, while they are likely going to move up as well, may not respond in the same magnitude because there are other considerations and influences. If the market thinks the economy may be tipped into a recession within the next few years, some participants may buy longer-term Treasuries as a safe haven to lock in the higher rates now.
So, in a nutshell, different parts of the yield curve are capable of moving differently. For instance, if the short end moves up faster than the long end, the curve starts to flatten and at some point inverts. This can happens during a rate hike cycle that pushes up the shorter-term rates more aggressively. And when the curve inverts and the economy sinks into a recession, Federal Reserve comes in to cut rates. That brings the short end down faster and over time the curve reverts back to a normal yield curve.
The Significance of an Inverted Yield Curve
What is the big deal about an inverted yield curve? There will definitely be implications for businesses. For example, it will hit the profit margins of banks. Banks typically borrow in the short term and lend out in the long term. Lower long-term rates limit their scope to charge higher interests. But I am not going to focus on businesses here. Because that is not the main reason people are drawn to the shape of the yield curve.
So why is the industry so uptight about an inverted curve? Even before the yield curve inverts, the market will be abuzz with news about the curve flattening. The reason is straightforward. Because historically, there is a good chance an economic slowdown or recession follows after the yield curve inverts. Since 1957, all recessions are preceded by an inverted yield curve occurring anywhere between 8 to 19 months earlier. These are information from the Federal Reserve Economic Data (FRED)

To measure inversion, we can use the difference between the 10-year and the 1-year yield. If it is positive, i.e. the 10 yr is higher than the 1-yr, this implies a normal yield curve. But if it is negative, then it means the yield curve is inverted. The blue line in the above chart tracks this difference. When it slipped below the black 0 line, it means the yield curve is inverted during that period. And the vertical grey shaded areas represent periods during economic recessions.
A Look At Some Yield Curves In The Past
Dot Com Crash in 2000
See how the yield curve transits from a normal one at the end of 1999 to an inverted one in 2000.

Great Financial Crisis in 2007
See how the yield curve transits from a normal one in early 2006 to an inverted in late 2006.

Covid-19 Pandemic 2020
The yield curve is also mildly inverted as of Sep 2019 prior to the full-blown Covid-19 crisis in 2020. Of course, I don't think anyone in the market sees the crisis coming. But well, the curve just happens to be inverted.

Where Is The Yield Curve Today
This is how the US Treasury yield curve looks month on month today.

As you can see, the yields across all maturities are moving up in line with the Federal Reserve's rate hikes priced into the market. As the cycle is just starting, the yield curve still looks very much like a normal one. So why is news about the yield curve flashing warning all over the place? Because if you observe each of the curves carefully, you can see a trend of the longer-term rates flattening out. That is part of the process of moving into inversion.
But that said, the yield curve is not yet inverted, especially if you look at the 10-yr vs the 1-yr or even the 2-yr. And even after it is inverted, who knows how long it will take before a recession hits if it really comes. News tends to sensationalize the slightest thing. Your best bet is always to know what is happening and observe it yourself.


Comments