
Investing In The US Markets - What You Need to Know About Currency Risk & A Falling Dollar
- Eng Guan

- Mar 6, 2024
- 8 min read
Anyone who invests in foreign markets will be concerned about currency risks. If you live in a country whose currency is strong, this can sometimes be a reason that deters you from investing outside of your homeland. Singapore-based investors faced such a dilemma. Should we diversify our investments beyond the borders? If you look at the past decade or longer, SGD has appreciated against most others be it the Greenback, Kiwi, Aussie, Euro, Yen, Pound, Yuan, or currencies of many other countries.
The degree to which currency can impact your investment performance varies. Developed countries’ currencies tend to be more stable while the risk with emerging countries can be substantially higher. But we also have to bear in mind that currency risk is just one component when looking at your investments. What matters is what you get at the end. Do you gain and is it worth the risk?
1. What is the impact of currency movement on a Singaporean investing in the US stock market?
Let us look at the case of a Singaporean investing in the US stock markets over an approximately 20-year period starting December 2003 to February 2024. As a proxy for the US stock market performance, we will use the S&P 500 ETF (Ticker: SPY), and all dividends are assumed to be reinvested.
Singaporeans are subject to a 30% withholding tax on dividends distributed by US-domiciled companies. So we will have to adjust for that. From 2003 to 2023, the average annual dividend yield of the S&P 500 is around 1.9% and 30% of this yield will come up to 0.57% per year. We factored that into SPY to account for the effects of this withholding tax. Then to see what impact currency movement has, we will measure the performance of the adjusted SPY in both USD and SGD terms.
As SGD has grown stronger relative to the USD during this period of evaluation, as a Singapore-based investor, we will expect to make less from an investment in the S&P 500 when we convert it back to SGD. And the calculated results are in line.
The yearly impact can fluctuate quite a fair bit
In some years, USD strengthened and benefitted your portfolio while in others it trailed behind SGD and became a drag. In these 20 years, currency fluctuations can add up to +6.8% or detract as much as -8.6% to your portfolio’s value when measured in SGD.

Over the long run, the impact is much more muted
In USD terms, the S&P 500 delivered an impressive Compound Annual Growth Rate (CAGR) of 9.5% with a volatility of 18.9%. At its worst point, it suffered a drawdown of 55.5% which happened during the Great Financial Crisis.
Then looking in SGD terms, the S&P 500 generated a slightly lower return of 8.1% which is still a good level. Volatility and drawdown differences are minimal as well. So overall, the impact of the strengthening of the SGD was acceptable as it only dragged the performance down by around 1.4% a year.


2. How does this compare to investing in the Singapore stock market?
The other question is would I have done better just investing locally in Singapore stocks instead? As a proxy for the Singapore stock market performance, we will use the Straits Times Index (Ticker: ^STI). To account for dividends which are a sizable component of STI, we adjust the STI to include an average annual dividend yield of 3% (STI’s dividend yield averaged 3% from 2008 to 2023) all of which is reinvested just like our earlier case for S&P 500.
STI outperform the SPY (SGD) in the earlier years before 2008 but falls behind thereafter
STI did better in the earlier years from 2003 to 2008 which coincides with the period when emerging markets are the center of attraction. That was the time when media were flying with news focused on the rise of Brazil, India, China, and Russia or BRIC. But not long after the Great Financial Crisis ends, STI starts falling behind the S&P 500.

Over the 20 years, SPY (SGD) fared better even after taking into account currency impact.
From 2003 to 2023, SPY in SGD terms delivered 8.1% CAGR against STI’s 6.2%. This is close to a 2% outperformance. In terms of volatility, STI was lower but did worse when it came to drawdown.

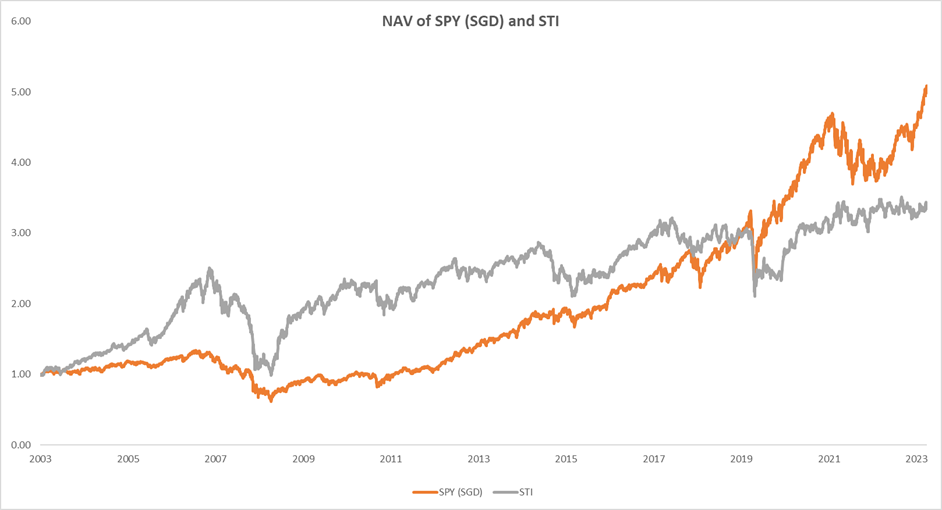
SPY (SGD) beats STI in the rolling 5-year return starting in 2009.
If we break up the 20 years into rolling 5-year periods, we can also see that SPY (SGD) yields a higher 5-year return for the bulk of the period since 2009.

The correlation between the US and the SG stock market is low.
Even though both are stock markets, US and SG stocks have a low correlation with one another. Their 6-month rolling correlation from 2003 to 2023 ranges from a low of -0.13 to a high of 0.58 with its average at 0.15. However, the correlation does rise during periods of global crisis such as during the Great Financial Crisis in 2008 and the Covid-19 pandemic in 2020. But having said that, if you are looking to diversify geographically among stocks, they still make a great pair.

3. Can we hedge against the USD currency risk?
There are limited ways for retail investors to hedge the risk directly. Hedging comes at a cost which can be hefty. So, the question to ask is this “Is it worth the cost and the added hassle?”
The most direct way you can hedge is to short the USD against the SGD in the spot FX market. But that means you have to pay the cost of carry which can be as high as 3.9% at the moment if you do this in Interactive Brokers. This cost of carry comes about because you shorted USD which has a higher interest rate (pay) and bought SGD which has a lower interest rate (receive). This differential will be further widened by the spread your broker charges and the total is the cost of carry you need to pay to maintain the hedge.


On top of that, you would also have to regularly adjust your hedge size and incur transactional costs as your portfolio value fluctuates up and down so that you don’t excessively over or under-hedge.
Hence, if you look at it objectively in the current environment, it wouldn’t make economic sense to pay the carry costs of almost 4% which is much higher than the 1.4% drag from currency movement.
4. Are there alternative ways to mitigate the impact of a falling USD?
Many big established companies within the US S&P 500 index run a global business so there is already some level of currency diversification. But if you are looking for more and are not averse to other asset classes, there are assets that can provide some hedge against a declining dollar. Gold and commodities, while denominated in USD, are physical assets whose value depends on global demand and supply. So if all things stay the same but the dollar weakens, you can expect the price of these assets to rise.
5. Will the US suddenly collapse on the weight of its debt?
This is not a new concern but the rapidly upward growing trajectory of the US debt does spark more talks of late. Many articles focus on the exponential growth of the absolute debt level which is not meaningful by itself. As an analogy, if someone sits on a debt of $10 million, the instant reaction of most people would be “That is too much! It is not going to end well for him!” But if I tell you this same person also makes $20 million a year, then the $10 million debt no longer looks that intimidating. Because we know he can service the debt and pay it off.
What would be more pertinent is the speed at which the US debt is rising relative to the country's growth and the size of this debt relative to the GDP. The debt is already the size of the GDP and the rate at which it is piling outpaces the GDP growth. So if nothing is done, it calls into question how much longer the US can keep borrowing and printing money to repay its debt. High debt levels will exact a toll on the US economy, curtail its ability to borrow further and limit its resources to fund its programs and implement monetary policies. That is the gist of the problem in a nutshell.
What people want to know is at what level will this become unsustainable? If you read around, you will find we are already past the level of what was once deemed unsustainable a decade ago and it is still business as usual. Some think we can go for at least another 20 years, some longer, some shorter, some don’t think it will happen. This is another big area for discussion which I will find time to address in another post. But, if I were to sum it up, no one knows when and how it will happen and if it will even happen. And if the US were to go down, there would be a long-drawn global winter. The world will go down with it. There will be hardly anywhere that is safe.
Your best bet against such catastrophic events is a diversified portfolio running multiple strategies that have the built-in flexibility to derisk and shift funds into safe havens such as gold or cash or enter long positions in volatility as a hedge as it adapts to the market environment.
AQ Advanced Multi-Strategy Model
Running a multi-asset and multi-strategy approach for your portfolio can help to improve the overall returns and stability. This gives your portfolio a bigger cushion against the scenario of a falling dollar.
The AQ advanced multi-strategy model portfolio, which can be implemented with the help of an investment adviser we worked with, runs multiple low to moderately correlated strategies spread across different asset classes from equities, bonds, and commodities to volatility using low-cost exchange-traded funds (ETFs). The different strategies work in conjunction with each other allowing the portfolio to adapt to different market conditions thereby reducing the risk while improving the long-term return.
Based on the net-of-fees model performance measured in SGD and after accounting for US withholding taxes from 2006 till Feb 2024, the AQ Advanced Multi-Strategy model delivered a higher return using a lower level of risk. It also has a significantly lower drawdown compared to SPY (SGD) and STI.


* This is the model performance constructed using more advanced strategies than those taught in our courses. They can be implemented with the assistance of an iFAST Global Markets (Singapore) senior investment adviser. Note that live performance may vary due to execution price slippages, the difference in sizing precisions, etc. All performances are measured in SGD terms.
Ending Note
It always pays to be cautious. But if you have concerns and fears, then you need to address them instead of letting them hold you back indefinitely. Working things out and knowing the risks and what they entail will help you see things with more clarity. And when you do take the next step, at least you know you have done your homework and made it based on good grounds.
Find out ways you can invest through a coffee session!

AllQuant brings to the table a new solution for busy professionals. We put all our 30 years of joint experience across asset management, banking, proprietary trading, and hedge funds to work. And we designed an actively managed multi-strategy model portfolio that is resilient enough to weather different market conditions.
You can now build such a portfolio through iFAST Global Markets without lifting a finger. In this collaboration, we are combining AllQuant’s expertise in hedge fund strategies and iFAST’s advisory capabilities and bringing it to your doorstep.
Ready to start your investment journey? Chat with us over a cup of coffee through a session facilitated by iFAST Senior Investment Adviser, Ou Da Wei, to find out more.
Disclaimer & Disclosure
We are not financial advisers or fund managers. The information published on this Site is provided for informational purposes only. It is not intended to be, nor shall it be construed as, financial advice, an offer, or a solicitation of an offer, to buy or sell an interest in any investment product. Nothing on this site constitutes accounting, regulatory, tax, or other advice.
Any performance shown on this Site is model performance and is not necessarily indicative nor a guarantee of future performance. You should make your own assessment of the relevance, accuracy, and adequacy of the information contained on this Site and consult your independent advisers where necessary.
AllQuant is carrying out introducing activities for iFAST Global Markets (Singapore) as an independent entity and is NOT an agent, servant, employee, representative, or in partnership with iFAST Global Markets (Singapore). AllQuant will be receiving remuneration or introducing fees from iFAST Global Markets (Singapore).


Comments